Chris NguyenTool Evaluation Series: LightdashLightdash is a dbt-oriented business intelligence (BI) platform designed for self-service analytics and metrics. It markets itself as an…5 min read·Jan 7, 2024----
Chris NguyenTool Evaluation Series: MetabaseMetabase is a self-service data analytics tool that is designed for fast and seamless analysis combined with great UX. I will evaluate…5 min read·Jan 7, 2024----
Chris NguyenTool Evaluation Series: HexHex is a collaborative, interactive notebook environment using SQL, Python, or no-code. It can be used for analysis but also to create data…5 min read·Jan 7, 2024----
Chris NguyenTool Evaluation Series: SupersetApache Superset is an open-source data exploration and visualization platform for data analysis. It is maintained by the Apache Foundation…5 min read·Jan 6, 2024----
Chris NguyenTool Evaluation Series: ModeEvaluation of Mode as a self-service BI tool for a general audience4 min read·Jan 6, 2024----
Chris NguyenA simple demo setting up metriqlHere’s a situation I run into often as a Tableau practitioner: I whip up a great and clever analysis in SQL that uses very precise steps to…9 min read·Dec 4, 2021----
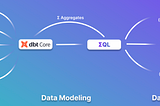
Chris NguyenWhat on Earth is…dbt?The orange logo that looks like a fidget spinner. The immense praise it gets every time it is mentioned. What is dbt? In 5 minutes or less…5 min read·Jul 5, 2021----
Chris NguyenWhat on Earth is…Google Analytics?A few months ago, I was asked to work with some data in Google Analytics (GA) at my workplace. I had never used it before and was only…4 min read·Jun 14, 2021----
Chris NguyenData Dissection: The Icicle ChartA few months ago, I was trying to figure out how to create a sunburst chart in Tableau when I came across Ken Flerlage’s blog post on it…4 min read·Jun 7, 2021----
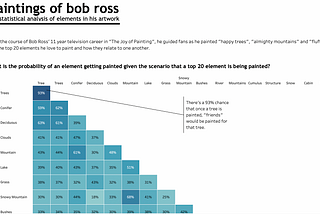
Chris NguyenData Dissection: Upper and Lower Triangular Correlation MatrixThis month, I’m going to try creating a correlation matrix visualization in Tableau. I stumbled upon this correlation matrix by Kelly Tan…4 min read·Jan 25, 2021----